Georgia Department of Transportation: I-85 Atlanta Bridge Collapse
What Happened
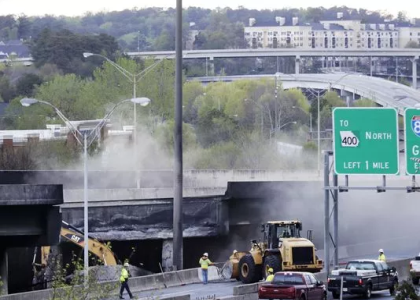
On Thursday, March 30, 2017, a fire started underneath a viaduct on I-85 about six miles north of downtown Atlanta.
The bridge collapsed at about 7 p.m. that evening.
GDOT's Response
The Georgia Department of Transportation (GDOT) responded to the fire by closing all five lanes of the highway in each direction, so that the area was emptied prior to the bridge’s collapse,
then set up local and regional detour plans. The I-95 Corridor Coalition (The Coalition) supported GDOT’s travel information actions,
while RITIS tools were used demonstrate how to monitor traffic conditions, evaluate performance impact and enhance collaborative decision-making.
Here’s how the event was managed and evaluated:
Provide Traveler Information
The Coalition updated their website to support GDOT’s regional traveler information efforts, as there would be substantial impact from detouring traffic around the closure.
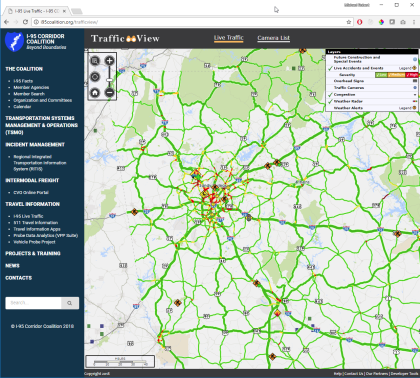
Additionally, the Coalition publicized the TrafficView web site to let the public explore real-time data. TrafficView, powered by RITIS, provided views of area congestion and live accident and event information that, coupled with detour routings, allowed travelers to make more informed trip-making decisions.
Monitor Performance
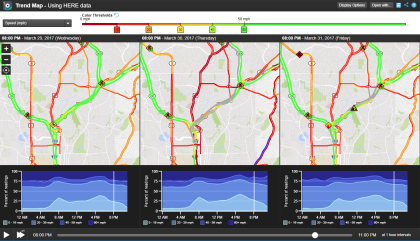
GDOT used Trend Map was used to compare the congestion impacts on the day of the bridge collapse with the day before and day after.
This helped operators understand temporal and spatial shifts in traffic. This intelligence information was used to adjust detour routings and signal timings to better manage overall traffic flow.
Estimate User Delay Cost
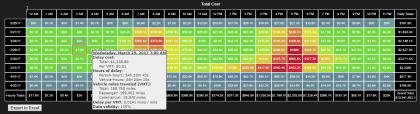
The User Delay Cost Analysis tool was used to identify a number of impacts the bridge collapse had on the regional roadway network, most notably the increase in overall delay and user cost increases.
To learn more about the I-85 Atlanta Bridge Collapse, see this presentation from the June 2017 RITIS User Group Meeting.
The Benefits
Using RITIS tools during the bridge collapse would have been beneficial to GDOT for:
- Monitoring local and regional traffic patterns and impacts
- Managing road closures, detour routes, signal systems, etc.
- Review the actions taken, in terms of congestion, delay and cost impact, to better prepare for and manage other large-scale events
PennDOT: I-276 (PA Turnpike) Closure
What Happened
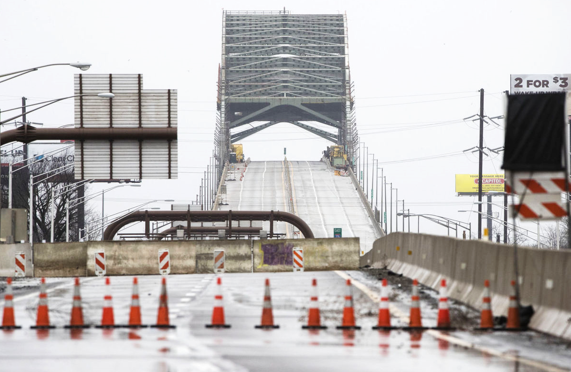
The Delaware River bridge connects the PA and NJ Turnpikes, serving 42,000 motorists each day. On Friday, January 20, 2017,
a fractured steel truss was spotted under the bridge decking on the PA side of the bridge, necessitating an immediate closure.
PennDOT's Response
PennDOT rerouted local traffic, aiming to minimize disruption to local traffic. During this period, local roads and three other bridges were burdened with larger-than-normal
traffic levels, making it critical to monitor travel times, identify congestion increases and quickly identify when an incident occurs to ensure minimal traffic impact.
A Regional Traffic Management Plan process was put in place, and was being adjusted daily to respond to problems, so PennDOT’s Traffic Management Center
operators had to monitor the effectiveness of its rerouting response.
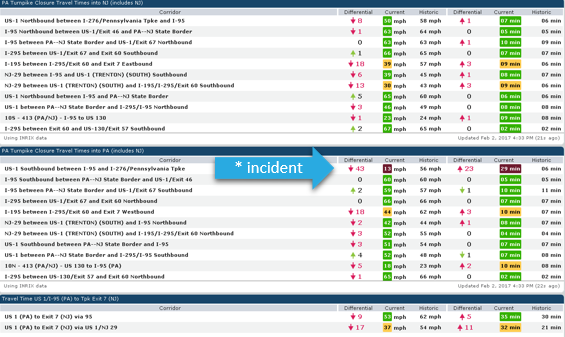
They used the
Dashboard tool to manage the regional impacts of the closure. Operators monitored area travel times during peak periods,
and shared results with other agencies and their consultants at the conclusion of each peak period. This process helped to better mitigate the bridge closure traffic impacts.
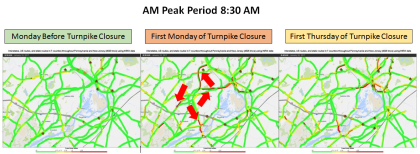
PennDOT also used
Trend Map to understand regional impact of peak period traffic to adjust their Regional Traffic Management Plan.
The Benefits
With Dashboard, PennDOT was able to:
- Confirm the effectiveness of their Traffic Management Plan
- Improve quick clearance times of incidents
- Evaluate the effect of signal timing changes on a key arterial
PennDOT has used Dashboard for other purposes, such as the Papal Visit, work zone monitoring, critical roadway network monitoring, and more.

