
Planning
Use Cases
Use Case:
Evaluate the Impact of an Event
Measuring corridor performance helps agencies focus on policies, projects and programs that are performance-based, to systematically address recurring and non-recurring congestion.
Measuring corridor performance helps agencies focus on policies, projects and programs that are performance-based, to systematically address recurring and non-recurring congestion.
Tracking performance metrics lets you discover mobility trends: changes in speed, travel time, and numbers of incidents. With the right tools, you can identify daily or seasonal patterns and congestion hot-spots. Now you can allocate resources and prioritize project development based on real-life data.

The solar eclipse of August 21, 2017 inspired millions of people to travel to the eclipse’s path of totality. South Carolina was one of those states that was plunged in total darkness.
The South Carolina Department of Transportation (SCDOT) anticipated substantial travel, especially on major interstates such as I-95, I-77, I-85 and I-26.
Long before the eclipse, SCDOT posted messages on electronic displays to encourage travellers to plan ahead.
SCDOT made a Traffic Management Plan to restricting roadwork, and increase patrols and other services. They also worked to prepare 511 real-time traffic information for all SC interstate highways.
CATT Lab conducted an after-action review for SCDOT to analyze its performance in easing congestion during this rare event.
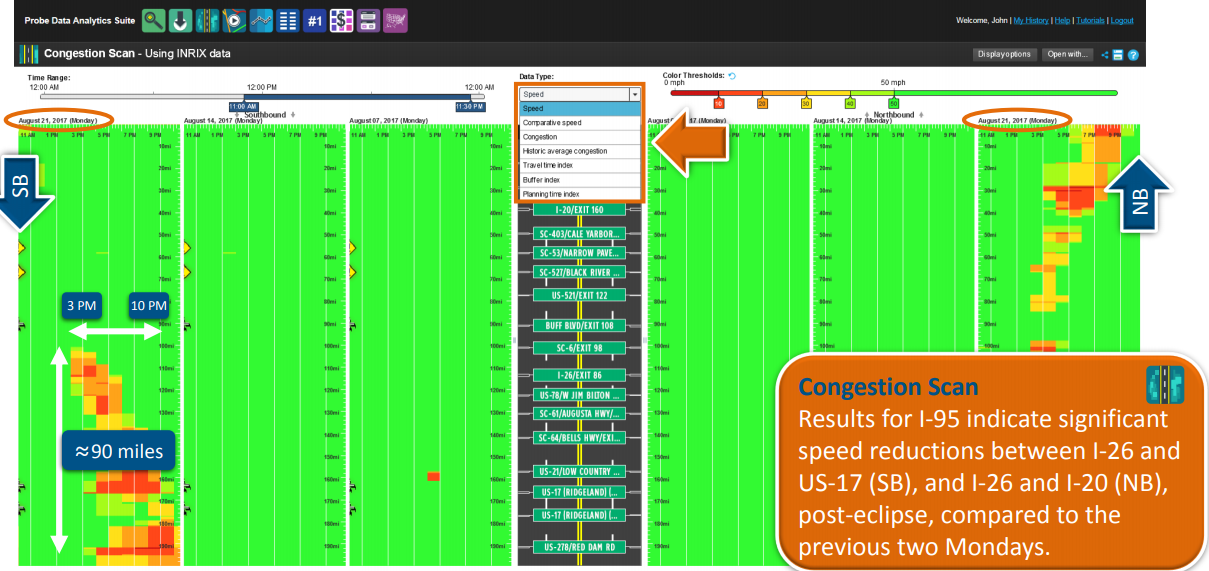
The total eclipse arrived on the state’s western border at 2:36pm and passed the Atlantic coast at 2:48pm. Four RITIS tools were used to examine the chronology of events.
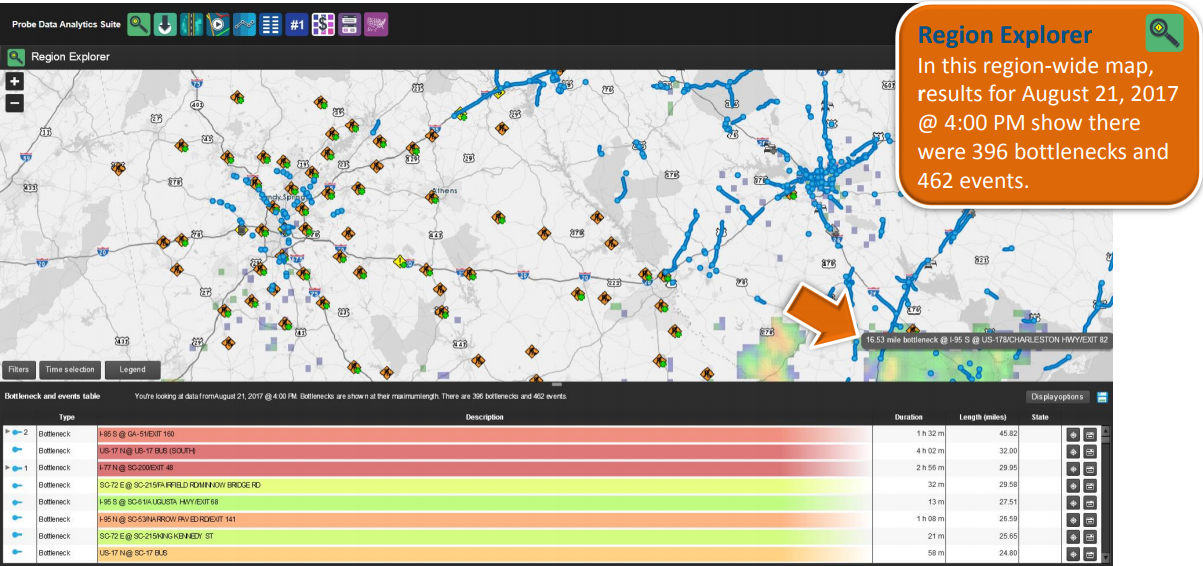
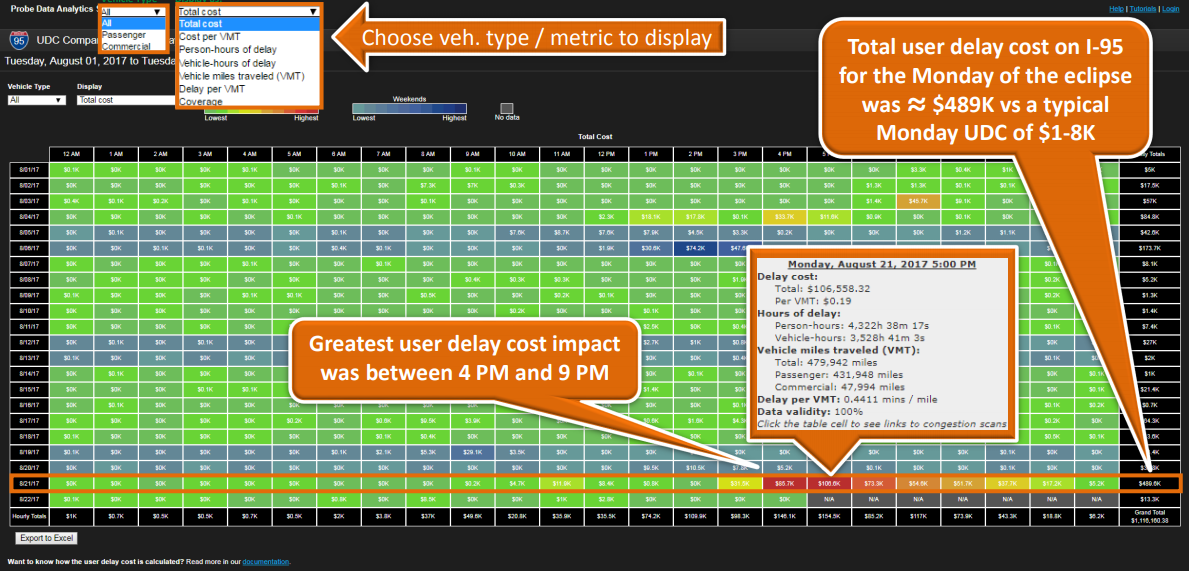
The PDA Suite provides a broad range of analytics that could be used to evaluate the traffic impacts that occurred, and gain additional insight to improve future major event traffic management and travel advisories.
