
Traveler Information
Use Cases
Use Case:
Create a Travel Guide
When an annual holiday causes traffic headaches, a holiday travel guide helps drivers understand their options
When an annual holiday causes traffic headaches, a holiday travel guide helps drivers understand their options
A good guide will predict the best and worst days to drive, show where congestion (or accidents) are the worst and encourage drivers to travel during off-peak hours or on less-travelled routes.
RITIS has years’ worth of data and several tools that you can use to help evaluate historic temporal and spatial congestion trends along roadways, to help predict future travel patterns and timing.
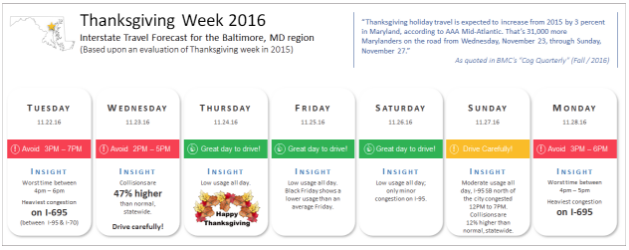
Below is an example created by the CATT Lab for using PDA Suite and RITIS apps to create a driving forecast graphic for Thanksgiving Week.

Thanksgiving Week has some of the busiest travel days of the year, impacting many of the Nation’s major roadways. And most recently, more and more travelers are opting to leave on Tuesday instead of the more traditional Wednesday, further extending travel impact.
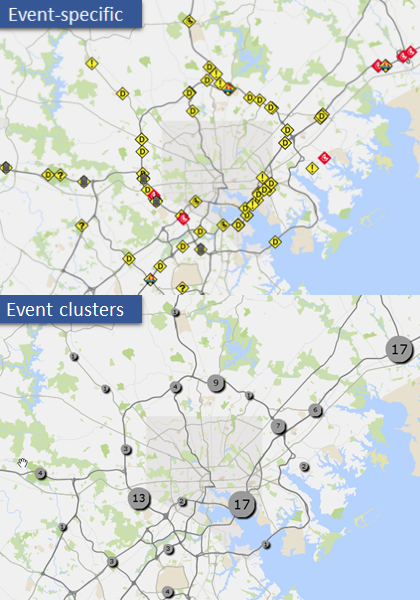
Leveraging RITIS and the PDA Suite, the CATT Lab developed a step-by-step “how-to” guide for agencies to create a driving forecast graphic (example shown for the Baltimore, MD region) that can be shared with the public ahead of the holidays:
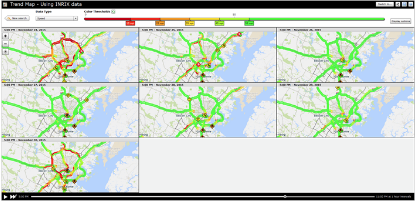
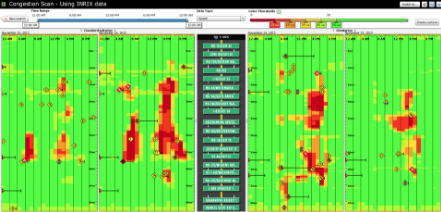
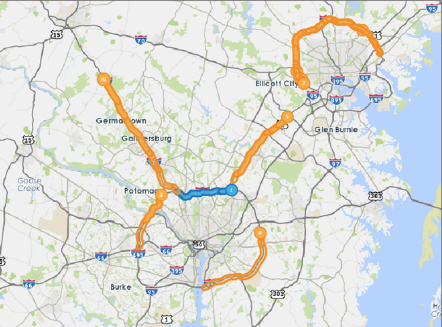
Here’s a look at the tools that were used to help create this graphic.
Developing this infographic to share with the public has these benefits:
